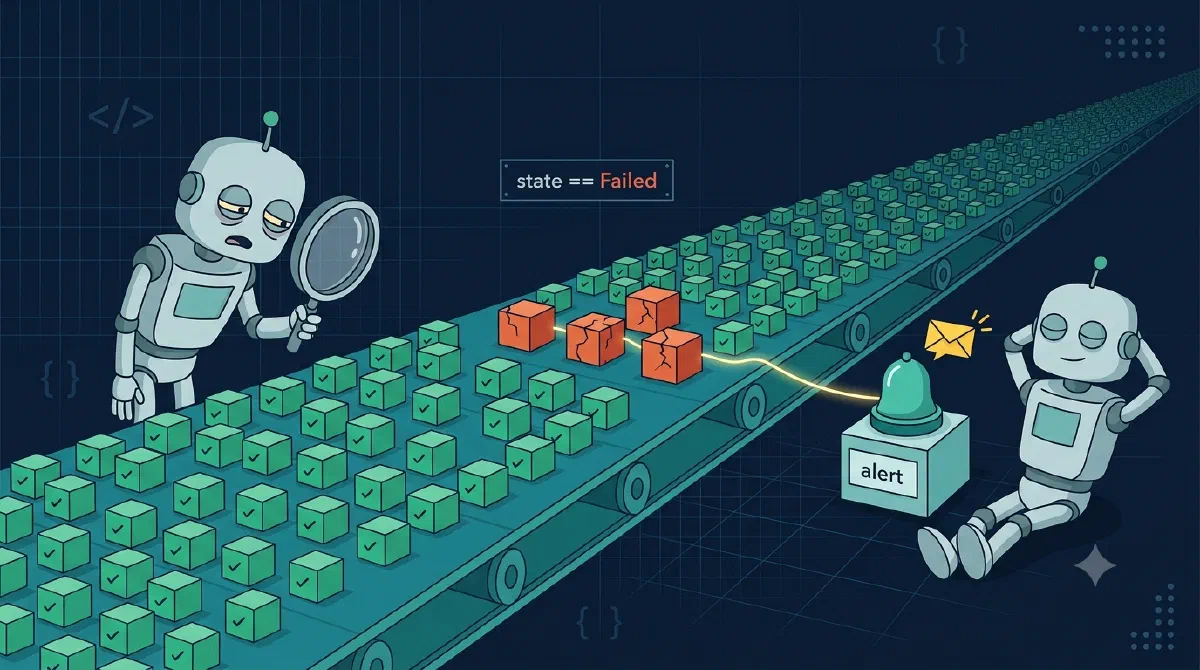
I’m in the middle of a bulk provisioning run: a queue message per new customer, one Durable Functions orchestration per site, more than 10,000 sites to create. Three of them have failed.
I know that because I’ve been opening the portal several times a day and looking. There’s a customer deadline on this run, and if the failures turn out to be a pattern rather than three unlucky sites, I want to stop the whole thing before it creates 9,000 more. So I check. Manually. Like a night watchman without a bell.
Three failures out of ten thousand is a rounding error until it’s the three sites belonging to the customer who calls.
TL;DR
A failed Durable Functions orchestration doesn’t announce itself anywhere. The cheapest way to hear about it is a log search alert in Application Insights: querytraces for the Durable extension’s own lifecycle events, filter to functionType == "Orchestrator" and state == "Failed", drop replays with isReplay != true, and fire on any row at all. Around $1.50 a month, zero lines of code, and the KQL can be widened later without a deployment.A Failed Orchestration Tells Nobody
Here’s the thing that makes this harder than it sounds: nothing surfaces a failed orchestration on its own.
My orchestrator wraps the whole run so a failure gets written to the status list before it propagates:
private async Task<ProvisioningContext> ExecuteProvisioning(Func<Task<ProvisioningContext>> action)
{
    try
    {
        return await action();
    }
    catch (Exception ex)
    {
        _logger.LogError(ex, "Provisioning failed.");

        // Try to update status, but never let a status-update failure mask the original error.
        try
        {
            await TryUpdateStatus(errorMessage: ex.Message);
        }
        catch (Exception statusEx)
        {
            _logger.LogWarning(statusEx, "Failed to update status after provisioning error.");
        }

        throw;
    }
}
That bare throw; is the load-bearing line. Because the exception isn’t swallowed, the instance ends in runtime status Failed instead of quietly finishing as Completed with half a site behind it. Good. But Failed is a row in a storage table and a red badge in a tool nobody has open at 21:00.
And getting there takes a while. Every activity call runs under a retry policy of 10 attempts with exponential backoff from 5 seconds up to 5 minutes, so an activity that can’t succeed spends roughly 25 minutes failing before the orchestration is allowed to give up. The hub association step is the reigning champion: JoinHubSite can return 200 and silently do nothing on a freshly created site, so the activity reads the association back and throws a plain InvalidOperationException when it didn’t stick. Plain, on purpose, because that one usually is transient. It gets all ten attempts before the orchestration dies. If you want the other half of that story, permanent versus transient failures is about which exceptions deserve the full ten.
So the failure is real, it’s slow, and it’s silent. I needed the bell.
Three Ways to Get Told, and Why I Picked the Boring One
I had three options on the table.
Publish an Event Grid event when the orchestration fails. I already run Event Grid in this solution, so the plumbing exists. But it means code in the failure path, a new event type, a subscriber, and a deployment. And every time I want the notification to say something slightly different, that’s another deployment.
A timer-triggered watchdog. A function that wakes up every N minutes, queries the instance table for anything in Failed, and shouts. Also code, also a deployment, plus its own state to remember what it already shouted about. Now I have two things to monitor: the pipeline and the thing watching the pipeline.
A log search alert in Application Insights. No code at all. The Durable Functions extension already writes lifecycle events for every orchestration, and I already have an action group wired up for this customer’s other alerts. Write a KQL query, point an alert rule at it, done.
I picked the third one, and the deciding argument wasn’t elegance. It was that I bill by the hour. The alert costs about $1.50 a month; writing and deploying either of the other two costs more than that in the first fifteen minutes, and then keeps costing every time it needs a tweak. The KQL, by contrast, I can widen tomorrow, from the portal, without touching the function app.
The two code options are better if you need the failure to do something automatically. Mine only needs to reach a human.
Durable Functions Already Logs Every Failure
The reason no code is needed: the Durable extension emits tracking events to Application Insights for every lifecycle transition, under the log category Host.Triggers.DurableTask. They land in the traces table, and everything useful is hiding in customDimensions behind a prop__ prefix.
This is the query behind the alert:
traces
| where customDimensions.Category == "Host.Triggers.DurableTask"
| extend functionName = tostring(customDimensions["prop__functionName"])
| extend functionType = tostring(customDimensions["prop__functionType"])
| extend instanceId   = tostring(customDimensions["prop__instanceId"])
| extend state        = tostring(customDimensions["prop__state"])
| extend reason       = tostring(customDimensions["prop__reason"])
| extend isReplay     = tobool(tolower(customDimensions["prop__isReplay"]))
| where isReplay != true
| where functionType == "Orchestrator" and state == "Failed"
| project timestamp, functionName, instanceId, reason, appName = cloud_RoleName
What’s happening here?
- The category filter is the whole trick.
Host.Triggers.DurableTaskis the extension’s own channel, separate from anything my code logs, so the query keeps working no matter how I change my own logging. - The
extendblock lifts the tracking fields out of the dynamiccustomDimensionsbag and casts them to strings. Withouttostring, comparisons against dynamic values get weird in ways that cost you an afternoon. isReplay != truedrops replayed history. Orchestrators replay their execution constantly, so without this filter a single failure can produce the same tracking event more than once, and your alert email count stops meaning anything. I wrote it in defensively from the start rather than learning it the fun way.functionType == "Orchestrator"is the difference between “a run failed” and “an attempt failed”. Activities emitFailedevents too, and with a 10-attempt retry policy a perfectly healthy orchestration produces a pile of them on the way to succeeding. Filter to the orchestrator and you get one row per genuinely dead run.reasoncarries the error details, so the alert email arrives with the instance ID and the actual message. That’s the difference between “go look” and “here’s what broke”.
The Alert Rule, Setting by Setting
Nothing exotic, and that’s the point:
- Signal name: Custom log search
- Query type: Aggregated logs
- Measure: Table rows, Aggregation type: Count, Aggregation granularity: 5 minutes
- Threshold type: Static, Operator: Greater than, Threshold value: 0
- Frequency of evaluation: 5 minutes
Static threshold, not dynamic. Dynamic thresholds learn a baseline and alert on deviation, which is the right tool for something with a natural rhythm. The natural rhythm of failed provisioning runs is zero. Any row is an incident, not an anomaly.
Threshold 0 on row count with a 5-minute window means “tell me about the first one”, which is exactly what I want during a bulk run. Three failures out of ten thousand is fine. Three failures in ten minutes means the hub is down and I should stop the queue.
The action group sends mail to me and to the customer’s IT department. That second recipient changed how I write the alert description: it has to make sense to someone who has never seen a task hub. The description says what failed, where the instance ID can be looked up, and who does what next.
Why Would the Alert Miss a Failure? Sampling.
Application Insights samples telemetry under load, and traces is sampled by default. A high-volume run producing thousands of lifecycle events per minute is exactly the situation where sampling starts dropping rows - including, possibly, the one you’re alerting on.
This is also the answer to the more general complaint that Azure Functions invocation logs go missing sometimes, or that App Insights alerts miss exceptions that definitely happened. The telemetry isn’t lost because something broke; it was sampled out, and sampling gets more aggressive precisely when things are busiest. Which is when you need it.
If your run is that noisy, look at samplingSettings in host.json before you trust the alert. Raising maxTelemetryItemsPerSecond or excluding types from sampling is a one-line change, and the Azure Functions monitoring docs spell out the trade-off. The uncomfortable part is that an alert built on sampled data fails silently: you don’t get a wrong answer, you get no answer, which looks identical to nothing having gone wrong.
Gotchas
- Failed is not the only bad ending. An orchestration stuck in
Runningnever emits aFailedevent, so this alert says nothing about it. With retries nested inside HTTP-level retries, a single activity can hold a run open for a long time and look perfectly healthy. If that’s a risk for you, a second alert on orchestration duration is the companion piece. - Alert on the orchestrator, not the activity. I cannot stress this one enough. Drop the
functionTypefilter and your retry policy becomes a mailing list. Every attempt underCallActivityWithRetryAsync(orCallActivityAsyncwith retry options) logs its ownFailedevent, so one healthy orchestration that recovers on attempt four has already emitted three of them. isReplayis not optional. Replay is normal behaviour, not a fault, and the same lifecycle event can show up more than once without that filter.- A threshold of zero only works if failures are rare. Mine are. If yours are routine, raise the threshold and treat the alert as a rate detector instead, or you’ll train yourself to archive the mail unread.
- The alert is detection, not remediation. Getting the mail is step one. Knowing what to do with a
Failedinstance, and whether a rerun is safe, is a separate problem that idempotent activities exist to make answerable.
Wrapping Up
A failed Durable Functions orchestration is loud in the storage table and silent everywhere a human looks. The Durable extension already logs every lifecycle transition to Application Insights, so the cheapest possible monitor is a KQL query over traces filtered to non-replay orchestrator events in state Failed, wired to an action group you already own. Rule of thumb: before you write a watchdog, check whether the thing you want to watch is already logging it. Mine was, and the difference between knowing and not knowing cost me $1.50 a month.
New to this corner of Azure? Durable Functions: A Function That Sleeps for a Week is where the rest of this series starts.
References